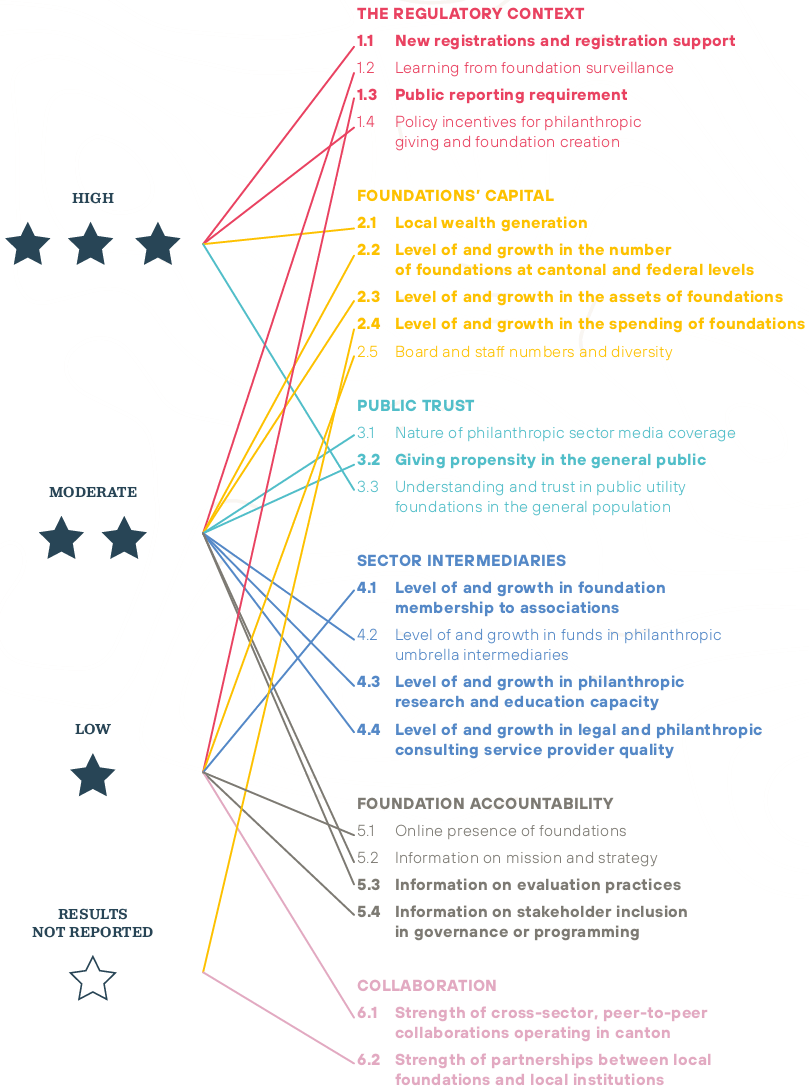
The holistic study methodology resulted in a wealth of findings. To ensure concision and easy readability of the report, its main body concentrated on fresh or especially action-relevant insights. This appendix presents the remaining findings (highlighted in Figure 13), which were either inconclusive or consistent with conventional wisdom about the Lemanic philanthropic sector. We report them here both for completeness and because they may be of interest to the specialized reader.
Figure 13: Summary of indicator results
The Regulatory Context
1.1 New registrations and registration support
Registrations of new foundations in both Geneva and Vaud have continued to grow rapidly. Between 2014 and 2018, Geneva and Vaud witnessed the creation of 262 and 169 new foundations, respectively, at the cantonal and federal levels of supervision. Interestingly, the numbers of cantonally-supervised foundations in the two cantons were nearly identical over this time period (92 in Geneva and 91 in Vaud), showing that more Geneva-based foundations fall under federal supervision, likely due to Geneva’s more international orientation. In the same period, 178 foundations were liquidated in both cantons. In Vaud, 16 foundations were merged or transferred, showing an interesting effort at consolidation.
The assessment on the vitality of new registration also considered the pre-opinion service provided by surveillance authorities, whereby potential founders can seek counsel on the feasibility of their philanthropic project and the likeliness of approval by the authorities, which experts report is unique to Switzerland. Vaud cantonal authorities reported that about 50% of newly registered foundations receive this enabling service, and Geneva covered 100% of the 14 new cantonal registrations in 2018.
39% of perception survey respondents either strongly agreed or agreed that the pre-opinion service is useful to founders, with Vaud respondents more positive about the practice than their Genevan counterparts. This suggests support for these activities, as well as an opportunity for improvement and/or better communication of the value provided.
DG DERI Philanthropic Player Mapping
In June 2019, the State of Geneva (specifically the DG DERI), in partnership with Stiftung Schweiz, set a precedent for easier access to the philanthropic sector: it launched an interactive mapping of the philanthropic actors in Geneva available for both the public and philanthropic stakeholders.
Over 1,200 foundations are categorized by their sector of activity, type of foundation, and geographic realm. Intermediaries serving the philanthropic sector are also mapped such as academic institutions, umbrella associations, surveillance authority as well as legal and consulting firms. Actors are called upon to complement their entries with more information.
Figure 14: Philanthropic player mapping
Note: Map by Directorate General for Economic Development, Research and Innovation (DG DERI), Canton of Geneva, in partnership with Stiftung Schweiz.
1.3 Public reporting requirement
While reporting to surveillance authorities is required, as described above, that is not the case for public reporting. The Swiss Foundation Code (and the Global Philanthropy Data Charter29) do recommend public reporting to promote foundation effectiveness at all stages of the foundation “value chain,” from encouraging better governance and strategic decision-making to facilitating collaboration and impact assessment. Echoed in several studies in the sector for years, a culture of secrecy continues to hover over Swiss philanthropy, potentially at odds with a widely acknowledged global trend towards increased transparency and oversight (see Chapter 1). As previously described, a high level of trust in foundations still predominates in the region, but one of the biggest potential threats to that trust may reside in the lack of public reporting and transparency.
69% of survey respondents strongly agreed or agreed that public reporting of assets, spending, and activities contributes to the vitality of the sector, one of the strongest ratings received in the survey. Vaud experts were even stronger advocates of public reporting than their Genevan peers. The question asked about the importance of public reporting and not whether they felt that current reporting was at the right level or not. Their answer therefore reinforces a one-star vitality rating and the need to address sector reporting.
Foundations’ Capital
2.1 Local wealth generation
The Lemanic region’s economic dynamism, particularly in the last decade, has been well documented by Avenir Suisse in a recent study.30 Geneva and Vaud are among the four wealthiest cantons in Switzerland in GDP terms, and have seen relatively high GDP growth rates from 1997-2018, at 2.6% and 3.0% respectively, above the national average of 2.4% in nominal terms (although Geneva’s growth has slowed significantly since the 2008 financial crisis). As of 2018, Geneva had the third-highest per-capita GDP in the country, after Zug and Zurich.31
Switzerland is the top country globally in terms of the number of millionaires per capita, and over 41,000 millionaires, or close to 15% of the Swiss total, resided in Geneva and Vaud as of 2015. This is more or less on par with the cantons’ relative share of national GDP.32
2.2 Level of and growth in the number of foundations
(registered at cantonal and federal levels)
At the end of 2018, the Geneva cantonal foundation surveillance authority had 546 foundations under its supervision, compared to 1,035 in Vaud. Including foundations supervised at the federal level, there were 1,208 foundations in Geneva and 1,337 in Vaud.33 The total combined number of foundations has grown slowly but steadily since 2008.34
The three major types of foundations—operational, grant-making and mixed—represent 23%, 48% and 27% of foundations, respectively, in Geneva, compared to 34%, 46% and 20% in Vaud. The fields in which foundations act in the two cantons, at least judging by what is stated in their statutes, also appear similar. In Geneva, 24% support education and research, 20% culture and recreation, 18% social services and 12% international affairs. In Vaud, 23% support education and research, 24% culture and recreation, 21% social services and 10% health.35
Taking into account all foundations, the overall foundation densities in Geneva and Vaud of 24.4 and 17.4 foundations per 10,000 inhabitants, respectively, are both above the Swiss national average of 15.5.36 However, many experts interviewed called for a reduction in the numbers of smaller foundations, lamenting a fragmented landscape of small foundations who may not have the capacity to administer their engagement effectively or to provide grants large enough to have significant impacts on beneficiaries. This is particularly true in the context of increasing professionalization and rising compliance requirements, which result in additional costs that eat into the grant budget.
Our “moderate” assessment mirrors past studies and expert opinions seeing further consolidation potential in the sector. This could occur through transfers to umbrella or territorial foundations, mergers, or at least greater collaboration between smaller foundations to enable more effective interventions through synergies in shared administrative and management costs.
Figure 15: Foundation registrations (reg) and liquidations (liq) in the Lemanic region
Source: CEPS Basel
2.3 Level of and growth in the assets of foundations
Due to data constraints, we were only able to obtain data on foundation assets for those foundations under the supervision of cantonal surveillance authorities. The total assets of cantonally-supervised foundations in Geneva and Vaud grew at annual rates of 5.3% and 1.9%, respectively, between 2014-2017, outpacing the growth in the number of foundations in both cantons.
Thanks to the cantonal surveillance authorities, it was possible to quantify the growth of foundations with relatively large endowments (greater than 10 mn CHF), which is shown below in Table 3. In Geneva, in 2017, there were 82 such foundations meeting this criterion and 150 in Vaud. Foundations with over 10 mn CHF in assets, representing 86% of the assets of cantonally-supervised foundations in Geneva and 91% in Vaud, saw their assets grow at annual rates of 4.5% and 6.8% between 2014-2017. These rates of growth are in line with the Swiss Market Index in that period, and offset the negative effect of spending rates on assets.
The result represents a very healthy evolution in the assets of the larger cantonally-supervised foundations, considering that foundation assets are growing despite their spending in the same period. Nevertheless, this is a privileged group of foundations compared to the smaller ones, many of which may not have the resources to deliver on their mission, leading us to rate the overall indicator as moderate. We recommend more research into how small foundations can optimally deploy their foundation capital for high social impact.
Table 3: Asset growth for cantonally supervised foundations by foundation size, 2014-2017
| Cantonal Authorities Only | 2014 | 2015 | 2016 | 2017 | CAGR |
|---|---|---|---|---|---|
| Total assets GE foundations (in CHF ‘000) | 4,442 | 4,639 | 4,893 | 5,184 | 5.3% |
| Total assets VD foundations (in CHF ‘000) | 6,556 | 6,583 | 6,775 | 6,936 | 1.9% |
| # GE foundations | 492 | 508 | 526 | 540 | 3.2% |
| # VD foundations | 1,031 | 1,038 | 1,041 | 1,045 | 0.5% |
| Assets GE foundations >10 mn CHF (in CHF ‘000) | 3,893 | 3,979 | 4,182 | 4,443 | 4.5% |
| Assets VD foundations >10 mn CHF (in CHF ‘000) | 5,186 | 5,666 | 6,190 | 6,313 | 6.8% |
| # GE foundations >10 mn CHF | 76 | 76 | 77 | 82 | 2.6% |
| # VD foundations >10 mn CHF | 121 | 133 | 146 | 150 | 7.4% |
| GE % of assets held by foundations >10 mn CHF | 87.6% | 85.8% | 85.5% | 85.7% | -0.7% |
| VD % of assets held by foundations >10 mn CHF | 79.1% | 86.1% | 91.4% | 91.0% | 4.8% |
| GE % of foundations > 10 mn CHF | 15.4% | 15.0% | 14.6% | 15.2% | -0.6% |
| VD % of foundations > 10 mn CHF | 11.7% | 12.8% | 14.0% | 14.4% | 6.9% |
2.4 Level of and growth in the spending of foundations
The data collected for this indicator did not enable us to draw conclusions strong enough to report here. Only SwissFoundations requires its member foundations to share comprehensive spending data as a condition of membership in the association. The aggregated statistics are disclosed on an annual basis (Lemanic region: CHF 154 mn in 2017). The collection and publication of clearer data on foundation activities and spending would be an important first step towards increasing transparency surrounding the sector, as noted in Chapter 4.
Public Trust
3.2 Giving propensity in the general public
Internationally, Switzerland ranks 26th out of 144 countries in the World Giving Index.37 Three criteria are evaluated in these studies: whether people donated money to charities, volunteered their time, and “helped a stranger” within the previous month. Notably, Switzerland performs much better on the two first criteria (13th and 11th, respectively) than on the third (116th).
Indeed, national rates of giving and volunteering propensity are 84% and 20%, respectively. While data is not available for Geneva and Vaud specifically, in Suisse Romande as a whole, these ratios are 80% and 15%, respectively.38 When this admittedly modest difference in rates of giving and volunteering is combined with an average gift size that is 50% smaller than in German-speaking Switzerland, Romandie seems to display a relatively weaker giving and engagement culture. Studies have explored how the region reflects different views on the relative weight of the state in providing welfare services, or the importance of religion.39,40
1.75x more stakeholders responding to the perception survey strongly agreed or agreed that volunteering is recognized and valued by the public (62% of respondents) compared to individual giving (35%).
Sector Intermediaries
4.1 Level of and growth in foundation membership to associations
Three associations were considered for the region: SwissFoundations, proFonds and the Association de Genève des Fondations Académiques (AGFA). Total membership in Geneva and Vaud across the three associations amounted to 113 organizations,41 or fewer than 5% of the 2,585 foundations registered in the two cantons, and even this number may include some double counting. While penetration is still very low considering the importance of associations in helping to professionalize the sector through knowledge exchange, the dynamic for some is highly positive: combined local membership for SwissFoundations and proFonds grew 9% per year between 2012 and 2018.
4.3 Level of and growth in philanthropic research and education capacity
The growth in philanthropic research and education capacity in Geneva and Vaud is very positive, but this growth comes from a low baseline and is quite recent, especially given the latent demand generated by the cantons’ 2,585 foundations.
Two new academic centers dedicated to philanthropy have emerged in the Lemanic region, filling an important gap in local research and education on philanthropy and foundation management: the GCP at the University of Geneva, created in 2017, and the Chair for Family Philanthropy at IMD, endowed in 2016.
IMD’s Chair for Family Philanthropy advances the region’s philanthropic sector with specialized research and capacity-building on practical giving tools for family businesses (i.e., not for foundations directly). The GCP uses an interdisciplinary model of research and teaching to strengthen the philanthropic sector in the Lemanic region. Despite still being in its infancy, it shows the potential needed to increase Geneva’s visibility and attractiveness globally as a philanthropic research hub. Since its founding in 2017, it has already grown its capacity significantly. With increased strategic partnership and funding from foundations, it nearly doubled the number of students, to 125; doubled the number of professors, to 10; and almost tripled the number of participants in local public events.
4.4 Level of and growth in legal and philanthropic consulting service provider quality
Legal intermediaries that reported their capacity for this study (eight of twelve contacted) have a total of approximately ten full-time equivalent (FTE) positions dedicated to philanthropy and foundations in the Lemanic region. This staff capacity has grown by an average of 15% annually for the last three years. Legal intermediaries report that the most frequent services provided concern tax- and governance-related questions, outreach to supervisory authorities, structuring (complex) philanthropic projects, data protection issues, and the establishment of foundations.
Specialized consulting intermediaries that reported their capacity for this study (four of five contacted) employ a total of approximately eight FTEs focusing on local philanthropic services. Their capacity has stayed stable or slightly declined in the last three years, although it must be noted that the data reported for this indicator was partial and had to be extrapolated in some cases.
For both types of intermediaries, the average number of FTEs per firm is quite small, suggesting that use of service providers by foundations is far from mainstream. This may also be influenced by the generally small size of Swiss foundations, whose needs for service provision, or ability to pay for it, might therefore also be somewhat lower. It is important to note, however, that the capacity reported only concerns the Lemanic region. Several of these firms, such as FSG (formerly known as Foundation Strategy Group), have significantly more staff who provide similar services to international clients, even though they are based in the Lemanic region.
The perception survey confirms the low use of intermediaries and the small number of specialized firms, but suggests that the capacity available is generally of high quality.
28% of perception survey respondents reported using intermediaries, another data point in line with the suggestion that many Lemanic foundations are small enough not to need, or be able to pay for, intermediaries’ services. Of those using intermediaries, however, 72% were either very satisfied or satisfied with the services provided.
Table 4: Overview of local specialized intermediaries (not exhaustive)
| Foundation associations | Umbrella foundations | Educational providers | Law firms | Consulting firms |
|---|---|---|---|---|
| AGFA | Fondation Ceres | Academie des Administrateurs | BMG Avocats | Carigest |
| proFonds | Fondation de L’Orangerie | Geneva Centre for Philanthropy | Bottge & Associés | FSG |
| SwissFoundations | Fondation Philanthropia | IMD Chair for Family Philanthropy | Froriep | Philanthropy Advisors |
| Swiss Fundraising | MyOwnFoundation | Kellerhals Carrard | Social investors | |
| ZEWO | Philigence | L.P.P.V | WISE | |
| Swiss Philanthropy Foundation | Lenz et Staehelin | Other independent providers | ||
| Meyerlustenberger Lachenal | ||||
| Oberson Abels | ||||
| Schellenberg Wittmer | ||||
| Sigma Legal | ||||
| Walder Wyss |
Foundation Accountability
5.3 Information on evaluation practices
For the same sample of 150 foundations used to evaluate indicator 5.2 (see Chapter 3), we found that few foundations sharing comprehensive information about evaluations of their activities (or internal processes):
- 45% do not publish any form of assessment
- 15% provide anecdotal process or program results (often through an annual report with high level activity descriptions)
- 29% share information regarding the evaluation of specific grants or participate in an accreditation scheme relevant for their type of activities
- 11% reflect deep evaluation practices, such as sharing insights on previous failures that led them to evolve their activities42
58% of perception survey respondents disagreed or strongly disagreed that foundations publish adequate impact assessments, one of the most critical ratings received as part of the perception survey.
5.4 Information on stakeholder inclusion in governance or programming
Analysis of the same sample of 150 foundations with websites yielded information regarding the extent to which the foundations communicate about including relevant stakeholders, and particularly beneficiaries, in their decision-making and evaluation processes:
- 51% made no mention of stakeholder inclusion
- 13% shared issue research (meaning they had engaged others to better understand the targeted social or environmental problems)
- 23% included the “voice” of beneficiaries, either through story-telling or quotes
- Only 13% described formal feedback mechanisms including advisory boards or regular stakeholder consultations.
We believe that increasing the last of those percentages would strongly benefit the philanthropic sector, as more inclusive practices build trust in the sector and lead to more effective interventions. It is also concerning in our eyes that 51% of the foundations in the sample did not mention any stakeholder inclusion practices at all, although of course the lack of a mention of such practices on the foundations’ websites does not necessarily mean that they do not happen.
As a part of the perception survey, foundation leaders were invited to provide further details about their own organizations’ practices regarding stakeholder involvement, and 45% reported that they include external stakeholders in their governance. 28 foundation leaders also shed light on their stakeholder inclusion practices: 36% invite external stakeholders to board meetings or have a stakeholder council, 36% consult stakeholders at program design stage, and another 25% at the end of programs. Only one respondent commented that her organization does not currently engage with stakeholders and does not plan to do so in the future.
40% of perception survey respondents agreed or strongly agreed that stakeholders influence key decisions and the programming of foundations.
Table 5: Spotlight on good online presentations of foundation accountability
| Fondation de Nant | ECLOF International | |
|---|---|---|
| Organizes public psychiatric care in the eastern region of Vaud | A platform for socially driven microfinance institutions that provide financial and non-financial services to micro entrepreneurs and smallholder farmers | |
| Canton | Vaud | Geneva |
| Mission / Strategy | Developed a strategic plan for 2018-2022 activities on how their work will impact specific target groups | Created a clear theory of change based on a set of principles and expected outcomes |
| Assessment / Insight | Performed an impact study of their activities as well as regular satisfaction surveys | Published a social performance report with results, measurement, lessons learned, and beneficiary perspectives to improve activities |
| Stakeholder Inclusion | Includes an advisory board represented by the psychiatric doctors they serve as well as publishes storytelling videos | Highlights the voice of the beneficiary through client stories with storytelling, photos and beneficiary perspectives |
Collaboration
6.1 Strength of cross-sector and peer-to-peer collaborations operating in canton
In the study Advancing Philanthropy in Switzerland, we highlighted collaboration between philanthropic actors as a key development opportunity. In the dense clusters of actors found in Geneva and Vaud, there are no geographical constraints for such collaborations. Nearly a decade on from that first study, the Lemanic region is hosting a greater number of local collaborations: we were able to identify 20 of them. Half are focused on supporting needs in the cantons of Geneva and Vaud. The local issues targeted include education, arts and culture, migrants and integration, employment and inter-generational relations, among others. Seventeen collectives are composed of cross-sector actors (including government and foundations), while three are alliances of only foundations. Fourteen are directly involved in implementation activities, five in knowledge exchange, and four in advocacy and movement-building. Several are international in scope.
Considering the over 2,500 foundations in the region and the potential for collaboration with at least 800 local international organizations and NGOs, not to mention all the cantonal and communal government agencies, this number of collectives seems fairly low. Our assessment is that these 20 collectives identified are probably a result of not having been able to identify all collaborations in the cluster in our research. As is, they would not even represent a “glass half full,” resulting in a one-star rating.
We assessed these collectives around the principles of collective impact – a concept widely adopted as a way to bring people and institutions together in a structured way to achieve social change.43 Collective impact is most successful when five conditions are in place:
- A common agenda binds the actors around a shared strategy that anticipates how independent and mutually reinforcing activities from different actors will contribute to positive outcomes for targeted beneficiaries;
- Mutually reinforcing activities are indeed shown to be making progress (as opposed to different actors pooling resources to fund a common project);
- The collaborators share a common measurement and evaluation system;
- The collective builds trust through continuous communications (as shown by the presence of periodic reports);
- Finally, and importantly, the collectives are supported by a backbone function, typically including full-time staff dedicated to sustaining the process of alignment and action.
Well over half of the collectives have a shared vision for change (the common agenda) and a dedicated team to orchestrate the work of the group (the backbone), as well as mutually reinforcing activities with a diverse set of stakeholders. However, similarly to foundations (see indicator 4.3), few have common evaluation and learning processes (the shared measurement).
38% Only 38% of the 104 perception survey respondents who answered the section on collaboration could cite a collaboration in the region. In all but one case, respondents who contributed an example believed that the collaborations cited were very effective or effective. While it is encouraging that such a high percentage of the named collaborations are seen as effective, the fact that only 38% of respondents could name one is surprising.
6.2 Strength of partnerships between local foundations and local institutions
We had difficulty deciding how to measure this indicator, and ended up trying to measure the share of the budgets of prominent local institutions, which had been donated by foundations or other philanthropic actors. Unfortunately, due to significant variations in record-keeping methodologies, the results could not be compared across institutions, and we therefore chose not to report on this indicator. Future studies in this area would benefit from work to further elaborate this methodology.